


Key Takeaways
- Reliability ratings measure owner-reported problems, not objective mechanical failure rates.
- A brand's overall score is an average across all its models, which can vary widely from one another.
- Ratings reflect a specific model year; a brand's score can shift significantly from one year to the next.
- New technology and new model launches often pull a brand's reliability score down temporarily.
- A rating does not predict what will happen to any individual vehicle you buy.
Car brand reliability rating
A reliability rating measures how often vehicles from a given automaker require unplanned repairs, based on owner-reported problems over a set period. Ratings are typically published by independent research organizations that survey large pools of car owners each year. The result is a score or ranking that lets consumers compare brands side by side on dependability.
Most ratings express reliability as problems per 100 vehicles (PP100), where a lower number means fewer reported problems. Scores are calculated separately for different vehicle segments, so a brand's overall rating may not reflect how one specific model performs.
How reliability ratings are built
The two most-cited sources in the U.S. are J.D. Power and Consumer Reports. Both survey large groups of car owners and ask them to report problems they experienced with their vehicles over a defined period. J.D. Power's Vehicle Dependability Study, for example, covers problems reported by original owners of three-year-old vehicles. Consumer Reports gathers data annually from its subscriber base across a broader range of model years.
The raw output is typically a problems per 100 vehicles (PP100) score. A brand with a score of 90 PP100 had owners report 90 problems for every 100 cars surveyed. A lower number means fewer reported problems. Ratings are then averaged across all models a brand sells to produce a single brand-level score.
Because both organizations rely on owner self-reporting, the data captures perceived problems, not verified mechanical failures. An owner who finds a new infotainment menu confusing may report it the same way another owner reports a transmission fault. That blending of software annoyances and mechanical failures is one limitation worth keeping in mind when reading a score.
What the numbers leave out
A brand-level score is an average, and averages can obscure large differences between models. A brand might sell a highly dependable compact sedan alongside a newly launched SUV that has early production problems. The brand's overall score blends both, and neither model's true picture is visible in that single number.
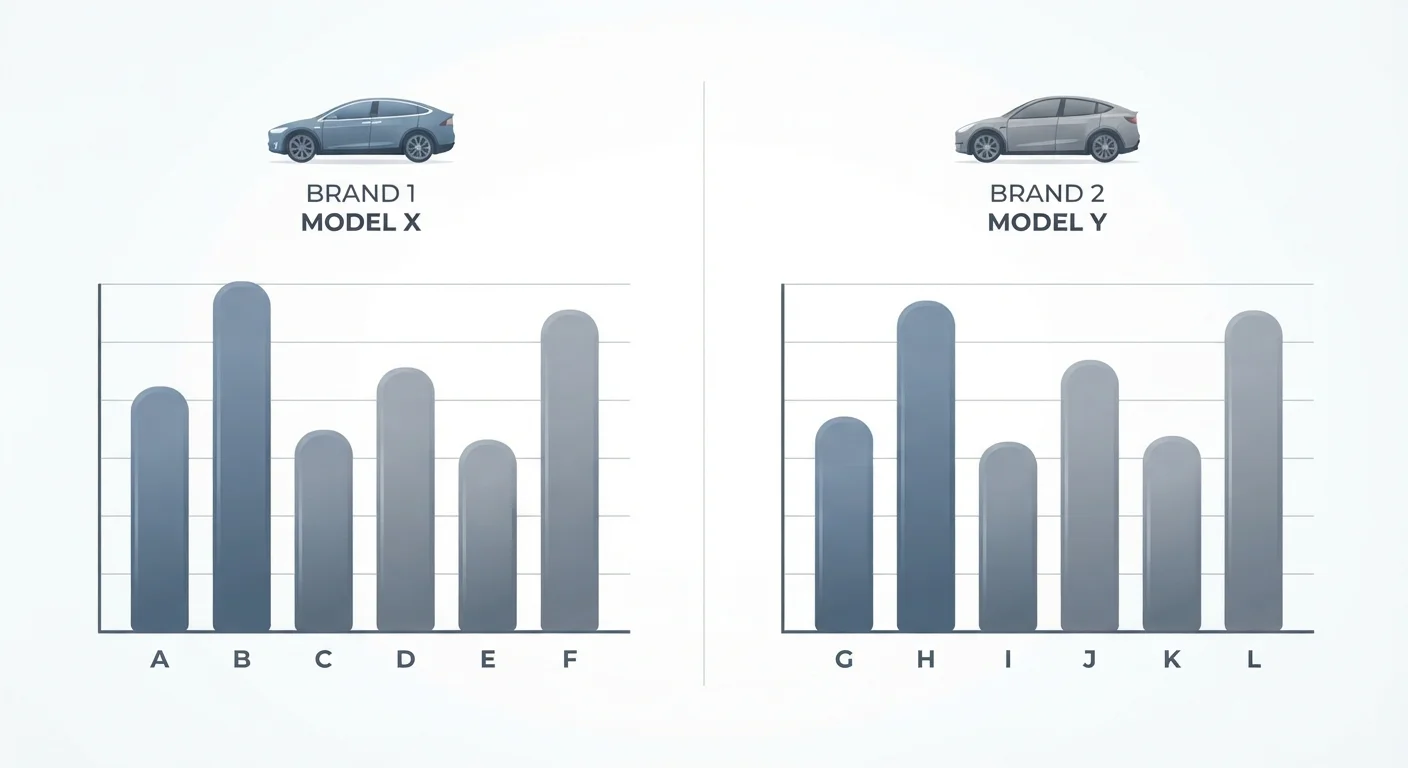
Model year timing also matters. When an automaker introduces a major redesign or a new powertrain technology, owner-reported problems often climb in the first production years before engineers resolve early issues. That pattern has appeared repeatedly across brands when new hybrid systems, large touchscreen interfaces, or electrified powertrains first reached consumers. A brand's score during that window may not reflect how those vehicles perform three years later.
Reliability ratings also say nothing about repair costs when something does go wrong, parts availability, or how a dealer network handles warranty claims. Two brands might post similar scores, yet one may have much higher average repair costs or longer wait times for parts. Warranty coverage is a separate factor that complements reliability data.
Look up model-year-specific scores
When researching a vehicle, search for reliability data tied to the exact model year you are considering, not just the brand's current score. Consumer Reports and J.D. Power both publish historical model-year results. A model that scored poorly in 2019 may have been revised and scored much better by 2021.
Brand scores versus model scores
For any specific purchase decision, a model-level reliability score is more useful than a brand average. Consumer Reports publishes predicted reliability scores by model and model year. J.D. Power publishes segment-level results that let you compare, for example, how one midsize SUV performs against another within the same category.
Honda's reputation for dependability, for instance, is well-documented at the brand level, but specific models within that lineup have historically scored above or below the brand average in different years. The same pattern holds for brands that carry a reputation for lower reliability: individual models sometimes outperform the brand's overall score by a measurable margin.
If you are evaluating a used vehicle, the same model-year logic applies. A rating published for a 2020 model year vehicle reflects owner experiences from that production run. Reading a used car listing carefully alongside that historical data gives a more complete picture than either source alone.
Putting ratings in context
Reliability ratings are one data point, not a purchase decision on their own. Maintenance history, mileage, storage conditions, and how a previous owner drove all affect the actual condition of any vehicle. Common myths about used car reliability covers how factors like high mileage are often misread as automatic disqualifiers, even when service records tell a different story.
Brand-tier position also matters for context. Entry-level, mid-range, and luxury brands operate under different cost structures, technology adoption rates, and buyer expectations, all of which influence how reliability data looks across tiers. A luxury brand adopting new suspension or software technology earlier than mainstream competitors may show lower reliability scores in the short term, not because the vehicles are poorly built, but because new technology generates more early owner-reported issues.
Treat a brand's reliability rating as context for asking better questions, not as a final answer. Pair it with model-specific data, a vehicle history report, and an inspection by a qualified mechanic before drawing conclusions about any specific car.